The Nenana Ice Classic
So maybe I should put some of that ‘R practice’ to work? I’m back in Alaska, and they’ve just started selling tickets for the ‘Nenana Ice Classic,’ a 100-year-old gamble on when the ice in the Tanana river will break up and melt, as determined by a clock on a tripod that is frozen into the river at the town of Nenana. It melted at 2:25 PM on April 24 last year, and has ranged from April 20 (in 1940) to May 20 (in 2013) over the last 100 years. The tickets go on sale (locally only!) on Feb 1, are available until April 5, and cost $2.50 per guess. You must provide a date and a time (to the nearest minute) for each guess. Last year the prize (shared or not) was $330,330!
The Nenana Ice Classic brochure provides data on the ice melt times for the past 100 years, so it was obvious to try to use these data to improve my guess(es). And in the process to get an intimate look at climate change in Alaska!
The data
I could have typed in the data from the brochure, but managed to find them already available online here (thanks to Carl Schwarz), and also at the National Snow and Ice Data Center. My cleaned-up data are in this CSV file. I then wrote a script for the statistical language ‘S’ and software ‘R.’ The analyses described here can be easily generated by running that script.
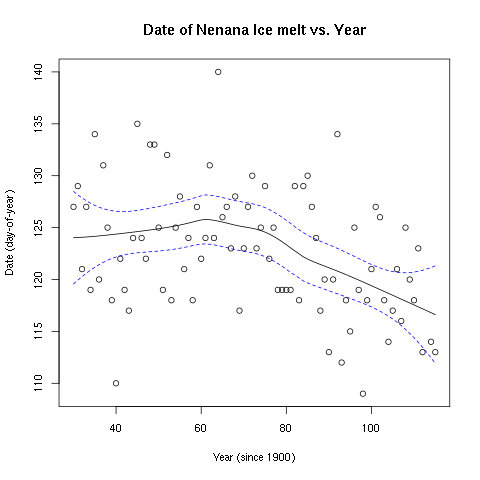
Fig. 1. Since about 1970, the ice has been breaking up earlier and earlier each year. (Points fitted with a loess regression.)
Trends in the data
The trend towards earlier dates for break-up each year is clear (Fig. 1). Similarly, each year the ice seems to be breaking up at a later and later time in the day (though the slope of the simple linear regression was not significantly different from zero; Fig. 2). How to model these data to best provide predictions for this year? I guess there must be complicated ways to incorporate time-of-day and day-of-year into a single temporal model of ice break-up, though I suspect that there are not enough data points to parameterize such a model. Instead, I simply modeled day-of-year and time-of-day independently.
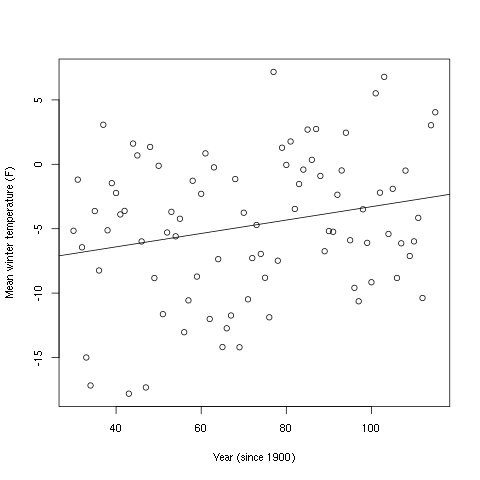
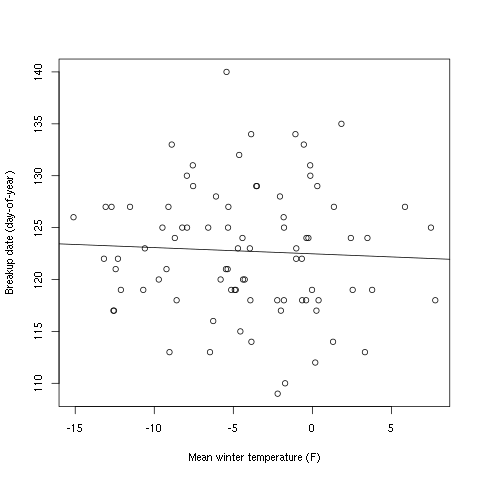
Now, while there seem to be strong trends in changes in mean day-of-year and time-of-day with increasing years, indicating that a prediction for 2016 should be at an earlier date and later time-of-day than one for 2015, there is also great annual variation in break-up time. What other available data could I use to add to the model? Mean daily temperature in the preceding winter months would seem to be a good choice. I was able to find these data (for Fairbanks) at the Alaska Climate Research Center, and you can find them here (a list of mean daily temperatures for every day since 1930). There is a very strong trend of increasing mean winter temperatures with time, consistent with a wide variety of other datasets that show that Alaska is warming; in these data, a simple linear regression against time gives a 5 degree C increase in temperature from 1930 to 2015! Plotting break-up day-of-year against winter temperature, there is an expected trend of warmer years (using five winter months) having earlier break-up dates. However, since winter temperature and year and break-up date all co-vary, we would expect this. Overall, the effect of year on breakup date was much stronger than that of mean winter temperature.
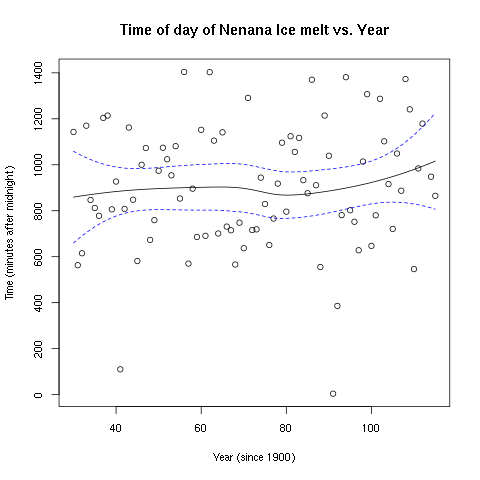
Fig. 2. There is a slight yearly trend towards the ice breaking up later and later in the day.
Making predictions
Armed with this understanding of trends in the data, I modeled i) break-up date and ii) break-up time-of-day as functions of year (since 1900) and mean winter temperature, using loess non-parametric regression. I extrapolated these curves one year, to 2016, using also the available mean 2015/16 winter temperature (3.4 F for Nov-Jan), and then selected (and combined) random dates and times based on the predicted standard errors around the exact predicted times. And voila! I have a set of dates and times to enter into my Nenana Ice Classic tickets! Should you not want to/be able to run the script yourself, here is a selection of the predictions you could use:
  2016-04-22 14:29 AKST
  2016-04-25 18:27 AKST
  2016-04-25 16:06 AKST
  2016-04-18 19:43 AKST
  2016-04-24 17:09 AKST
  2016-04-22 17:28 AKST
  2016-04-24 15:02 AKST
  2016-04-21 13:51 AKST
  2016-05-04 20:50 AKST
  2016-04-21 15:31 AKST
Remember though that should you win you will share the prize with others who submit the same date and time! You can see that almost all the predictions are in late April, one being for a date earlier than ever recorded (the 18th).
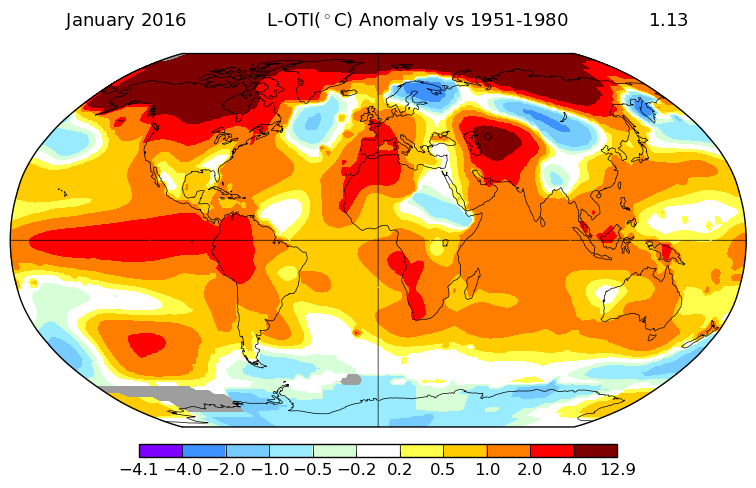
Fig. 3. January 2016 is the hottest global January on record! (Source: NASA GISS)
Climate change
Viewed in 2016, and from my own perspective, the shift towards earlier and earlier break-up dates is yet another indication of the rapid climate changes going on in the world around us. Indeed, in the months since I have been here, I have met very few Alaskans who deny that Alaska is rapidly getting warmer each year, though there is much disagreement about “why?” and about “what to do?” This unanimity in accepting the problem is heartening, and makes this an even more exciting place to be living. However, interpretation of the Nenana Ice Classic data has been quite controversial in the past. An outspoken critic of the climate change narrative, John Daly, contended that a 2001 Science paper (Segarin & Micheli 2001) that referred to the Nenana break-up data contained serious analytical errors. He did however point out the legitimate possibility that some of the change in break-up date might be due to increasing urbanization in Fairbanks, which is upstream of Nenana, and probably discharges some warm water into the Tanana river. The Wall Street Journal found the Ice Classic data compelling:
“The Ice Classic has given them a rare, reliable climate history that has documented to the minute the onset of the annual thaw as it shifted across 91 years. By this measure, spring comes to central Alaska 10 days earlier than in 1960, said geophysicist Martin Jeffries at the University of Alaska, Fairbanks -- and that trend is accelerating. ‘The Nenana Ice Classic is a pretty good proxy for climate change in the 20th century,’ Dr. Jeffries said.”
But ‘Watts Up With That’ (“The world’s most viewed site on global warming and climate change”) used the single event of a very late break-up in 2013 as evidence that climate change is not taking place! Ah well.
As I write this, NASA’s Goddard Institute for Space Studies has just published data that indicate that January 2016 is (globally) the warmest January ever (Fig. 3). Everyone has been telling me here (in Fairbanks) how mild the winter has been, implying that I can’t yet say I’ve experienced a ‘true Alaskan winter’ -- it’s only been a minimum of -25 degrees F! Some of this warmth seems to be due to ‘The Blob’ of warm water in the north Pacific, which is now dispersing, and next winter Fairbanks may be back to the minus-forties and -fifties. But overall there is now no doubt that Alaska is warming up, and fast. So if you’re picking dates for the Nenana Ice Classic... maybe take off a day or two for good luck!